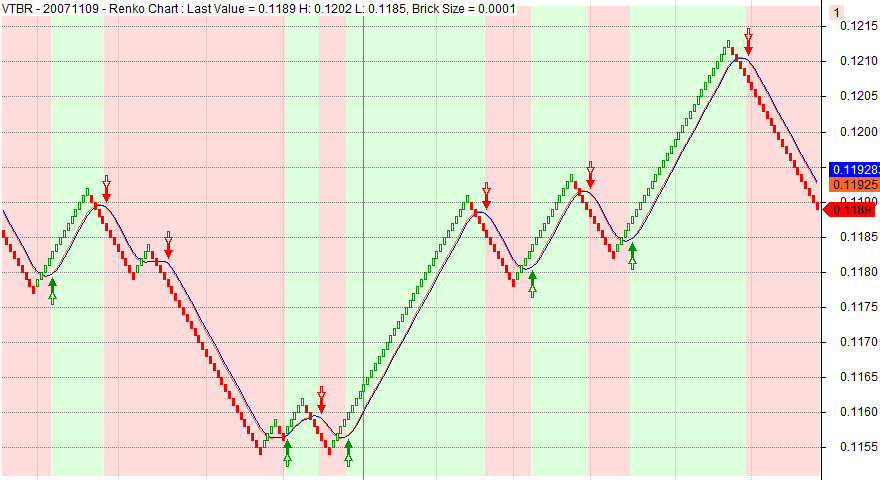
Creating A Trading Strategy, Part 3,” which appeared in the September 2014 issue of STOCKS & COMMODITIES, author Sylvain Vervoort
continued his article series presenting a trading system based on modified renko charts and moving averages.
We are providing a ready-to-use formula for AmiBroker. It is based on the formula that Vervoort presented in his
September 2014 article with the addition of trading rules, a colorized background, and moving averages for display in AmiBroker.
// Modified Renko Chart with custom date axis
// and high/low winks
// Loosely based on Renko chart formula by G. Kavanagh
// from AmiBroker on-line formula library (id=521)
// Modifications & fixes TJ 2014

function FillRun( dir, num, changedir )
{
       global i, j, modified, dt, RKC, RKO, RKD, RKH, RKL;

       for ( x = 1; x <= num AND j < BarCount - 1; x++ )
       {
           j++;

           extra = ( changedir AND x == 1 ) * dir;

           RKC[ j ] = RKC[ j - 1 ] + dir + extra;
           RKO[ j ] = RKC[ j - 1 ] + IIf( modified, 0, extra );
           RKD[ j ] = dt[ i ];
           RKH[ j ] = High[ i - 1 ];
           RKL[ j ] = Low[ i - 1 ];
       }
}

SetBarsRequired( sbrAll, sbrAll );
Brick = Param( "Brick Size", 0.001, 0.0001, 1.00, 0.001 );
reverse1 = 2;
intra = ParamToggle( "Intraday", "No|Yes", 0 );
modified = ParamToggle( "Modified", "No|Yes", 0 );

// Convert the closing price to rising and falling rounded bricks
CF = ceil( C / Brick );
CR = floor( C / Brick );

// initialize first element
j = 0;
RKC[j] = CF[0];
RKO[j] = CF[0] + 1;
RKD = 0;
RKH = 0;
RKL = 0;
dt = IIf( intra, floor( TimeNum() / 100 ), DateNum() );

dir = -1; // 1 is up, -1 is down

// Loop to produce the Renko values in number of bricks

for ( i = 1; i < BarCount - 1; i++ )
{
   if ( j >= BarCount )
       break; // no more room -> finish

   if ( CF[i] <= RKC[j] - 1 AND dir < 0 ) // Continue down
   {
       num = RKC[j] - CF[i];

       FillRun( dir, num, False );
   }
   else
   if ( CR[i] >= RKC[j] + Reverse1 AND dir < 0 ) // Change down to up
   {
       num = CR[i] - RKC[j];
       dir = 1;

       FillRun( dir, num, True );
   }
   else
   if ( CR[i] >= RKC[j] + 1 AND dir > 0 ) // Continue Up
   {
       num = CR[i] - RKC[j];
       FillRun( dir, num, False );
   }
   else
   if ( CF[i] <= RKC[j] - Reverse1 AND dir > 0 ) // Change up to down
   {
       num = RKC[j] - CF[i];
       dir = -1;

       FillRun( dir, num, True );
   }
}

// move the chart to right end of chart space, ie last brick on last bar position
delta =  BarCount - 1 - j;

RKC = Ref( RKC, -delta );
RKO = Ref( RKO, -delta );
RKD = Ref( RKD, -delta );
RKH = Ref( RKH, -delta );
RKL = Ref( RKL, -delta );

C = RKC * Brick;
O = RKO * Brick;
H = IIf( modified, RKH, Max( C, O ) );
L = IIf( modified, RKL, Min( C, O ) );

Plot( C, "", IIf( C > O, colorGreen, colorRed ), styleCandle );

m1 = MA( (C+H+L)/3, 8 );
m2 = MA( C, 8 );

Plot( m1, "SMA Typ", colorBlue );
Plot( m2, "SMA Renko", colorOrange );

Cover = Cross( m2, m1 );
Sell = Cross( m1, m2 );

Short = Sell AND C < O;
Buy = Cover AND C > O;

PlotShapes( shapeUpArrow * Buy, colorGreen, 0, m1);
PlotShapes( shapeDownArrow * Sell, colorRed, 0, m1 );
PlotShapes( shapeHollowUpArrow * Cover, colorGreen, 0, m1, -25);
PlotShapes( shapeHollowDownArrow * Short, colorRed, 0, m1, -25 );

color = IIf( Flip( Buy, Sell ), ColorRGB( 220, 255, 220 ),
         IIf( Flip( Short, Cover ), ColorRGB( 255, 220, 220 ), colorWhite ) );

Plot( 1, "", color, styleArea | styleOwnScale, 0, 1, 0, -1 );

xnum = floor( RKD / 1000 );
XChange = IIf( xnum != Ref( xnum, -1 ), 1, Null );

Plot( XChange, "", colorGrey50, styleHistogram | styleOwnScale, 0, 1 );

// Draw renko-date axis
MonthNames = "Jan,Feb,Mar,Apr,May,Jun,Jul,Aug,Sep,Oct,Nov,Dec";
fvb = FirstVisibleValue( BarIndex() );
lvb = LastVisibleValue( BarIndex() );

for ( i = fvb; i < lvb; i++ )
{
 if ( XChange[ i ] )
 {
   if ( intra )
      datetext = StrFormat( "%02gh", floor ( RKD[ i ] / 100 ) );
   else
   if ( ( xnum[ i ] % 100 ) == 1 )
      datetext = StrFormat( "%04.0f", 1900 + ( xnum[ i ] / 100 ) );
   else
      datetext = StrExtract( MonthNames, ( xnum[ i ] % 100 ) - 1 );

   PlotText( datetext  , i, LowestVisibleValue( Low ), colorGrey50, colorWhite, -20 );
 }
}

Title = Name() + StrFormat( " - 20%06.0f", RKD % 1000000 ) + " - Renko Chart : Last Value = " + RKC * Brick + " H: " + RKH + " L: " + RKL + ", Brick Size = " + Brick;

GraphXSpace = 5;