Взято из журнала "Stock & Commodities"
Январь 2014 года.
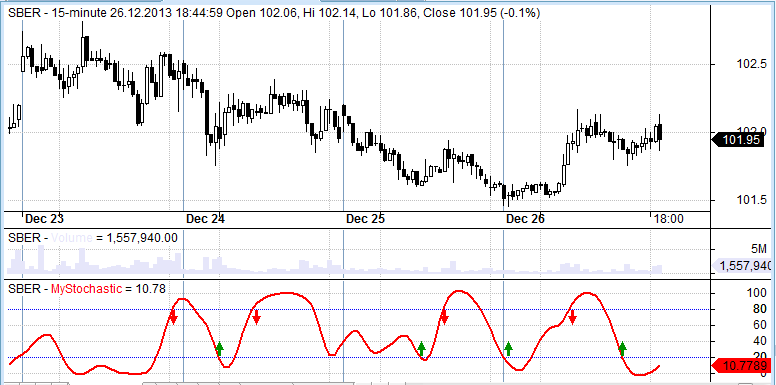
Predictive And Successful Indicators
In “Predictive And Successful Indicators” in this issue, author John Ehlers presents his SuperSmooth filter and uses it to create a
better stochastic indicator.
Ready-to-use AmiBroker code for the indicator is shown below. Note that SuperSmooth filter and high-pass filter have been written as
reusable, general-purpose functions so users can easily include them in their own systems and/or indicators. To display the indicators
on a chart, simply input or paste the code into the formula editor and press apply indicator. To backtest a trading system,
choose backtest from Tools menu in the formula editor.
PI = 3.1415926;
SQ2 = sqrt( 2 );

function SuperSmoother( array, periods )
{
    a1 = exp( -SQ2 * PI / periods );
    b1 = 2 * a1 * cos( SQ2 * PI / periods );
    c2 = b1;
    c3 = -a1 * a1;
    c1 = 1 - c2 - c3;

    Filt = Nz( array );

    for ( i = 2; i < BarCount; i++ )
    {
         Filt[ i ] = c1 * ( array[ i ] + array[ i - 1 ] ) / 2 +
                     c2 * Filt[ i - 1 ] +
                     c3 * Filt[ i - 2];
    }

    return Filt;
}

function HighpassFilter( array, periods )
{
    alpha1 = ( cos( SQ2 * PI / periods ) + sin ( SQ2 * PI / periods ) - 1 ) /  cos( SQ2 * PI / periods );

    HP = Nz( array );

    C1 = ( 1 - alpha1 / 2 ) ^ 2;
    C2 = 2 * ( 1 - alpha1 );
    C3 = - ( ( 1 - alpha1 ) ^ 2 );

    for ( i = 2; i < BarCount; i++ )
    {
        HP[ i ] =  C1 * ( array[ i ] - 2 * array[i-1] + array[i-2] ) +
                   C2 * HP[ i - 1] +
                   C3 * HP[ i - 2];
    }

    return HP;
}

ss = SuperSmoother( HighpassFilter( Close, 48 ), 10 );

Length = 20;


HighestC = HHV( ss, Length );
LowestC = LLV( ss, Length );

Stoc = ( ss - LowestC ) / ( HighestC - LowestC );

MyStochastic = 100 * SuperSmoother( Stoc, 10 );

Plot( MyStochastic, "MyStochastic", colorRed, styleThick );
PlotGrid( 20, colorBlue );
PlotGrid( 80, colorBlue );

Buy = Cross( 20, MyStochastic );
Sell = Cross( MyStochastic, 80 );

Buy = ExRem( Buy, Sell );
Sell = ExRem( Sell, Buy );
PlotShapes( Buy * shapeUpArrow, colorGreen, 0, 20, 8 );
PlotShapes( Sell * shapeDownArrow, colorRed, 0, 80, 8 );
—Tomasz Janeczko, AmiBroker.com
www.amibroker.com
Вы не можете комментировать
для добавления комментариев Вы должны быть авторизованы на
форуме